Under the direction of the Jordan Board of Education, Jordan School District is launching a COVID-19 Data Dashboard. The Jordan COVID-19 Data Dashboard will update parents and employees on current COVID-19 case counts in every school and office building so they can make the very best decisions for students, families and themselves. On this episode of the Supercast, we explain how the Jordan Data Dashboard works.
The Jordan COVID-19 Data Dashboard can be found at movingforward.jordandistrict.org
Audio Transcription
Superintendent Godfrey:
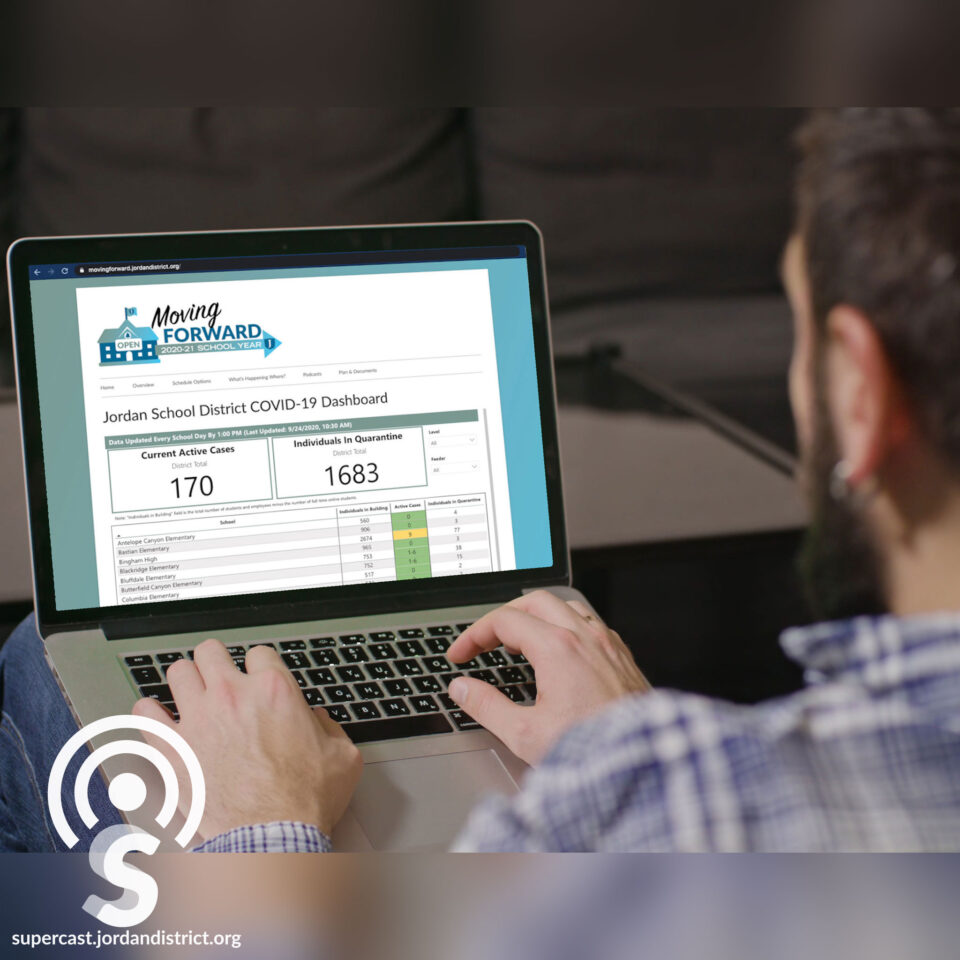
Welcome to the Supercast. I'm your host, Superintendent Anthony Godfrey. Under the direction of the Jordan Board of Education, Jordan School District is launching a COVID-19 Data Dashboard. The Jordan COVID-19 Data Dashboard will update parents and employees on current COVID-19 case counts in every school and office building so they can make the very best decisions for students, families, and themselves. The dashboard also shows the current number of students and staff in quarantine. Here to talk about the Jordan Data Dashboard and how it works is our Associate Superintendent, Mike Anderson and Planning and Enrollment Consultant, Caleb Olson. Thanks for joining me today. Most contracts in the District include the phrase, “other duties as assigned”, and this Data Dashboard falls under that category for you because you're someone who's skilled at just doing a lot of different things and pulling numbers together in a meaningful way. Caleb works with our enrollment numbers and our permits and works behind the scenes just to make all of that make sense for our schools, providing data districtwide. And so, I really appreciate your work on the Data Dashboard. I have it here in front of me and we've sent, along with the link to this podcast, a link to every parent and employee so they can access this. Can you just kind of walk me through the information that's included here on the dashboard?
Caleb Olson:
Yes. So, on the Dashboard at the top, where it's most visible and easiest to see, we have a total of the current positive COVID-19 cases in the District. And then we show a number that is the number of individuals districtwide in quarantine at the moment. Underneath that, you can see those same figures for each of our schools and the different work locations. When you go into the table at the bottom, it has a number that is the number of individuals in the building. And that number is the number of people that would be in that building or that location every day. It includes all of the students and all of the employees. Then we subtract out the number of full time, online students who don't come into school.
Superintendent Godfrey:
And the reason for reporting that number is that on Tuesday night, the Board decided that at certain percentage levels, certain things would happen at schools in response to an increase in the number of cases. So that number allows us to quickly see when we're approaching those percentage points.
Caleb Olson:
Exactly. We have that available so that any employee or any parent or any student can come and find their school and see what the situation is, what the case count is like at their building. There's also the ability to look at your feeder system, your area of the District, or to look at different levels of the district. You could see the totals for all of the elementary schools or the middle schools to kind of get that higher-level picture, if that's something you're interested in. Hopefully it's set up in a way that makes sense to our parents and our students and our employees so they can get the information they need to be informed when they make their decisions.
Superintendent Godfrey:
I know that with the County Data Dashboard, there are a lot of people hitting refresh throughout the day. There's a high level of interest in knowing what the latest numbers are. The banner at the top indicates that the data is updated every school day by one o'clock and then when it was last updated. It will be updated once per day. So, once you see that day's update, those are the newest numbers and that's where the numbers will be. Many times we'll get it before 1:00 PM. It's just that 1:00 PM is the latest an update will come.
Caleb Olson:
Yes. We want to make sure that by 1:00 PM, if you were to visit the site, you have the current numbers. What we don't want is to have cases trickle in or to have the number change throughout the day. We’ll update it and do our best to have it as quickly as possible. But by one o'clock every day, school is in session.
Superintendent Godfrey:
One of the things I like about the option to choose level or feeder system, first of all, is that you can compare how your high school or middle or elementary school looks in terms of the case in quarantine numbers compared with other schools in the district. There’s a lot of usefulness for the feeder systems as well. “Feeder” is a term we use a lot. It basically means the elementary schools that feed into a particular middle school and the middle schools that feed into a particular high school. Some places call it a pod. But basically, looking at the feeder statistics allows you to see whether there's a trend with any particular community. And we can look and see that not only is a particular high school seeing higher numbers, but we're seeing a spike at the middle school and at the elementary level as well. That actually hasn't happened yet. The highest numbers have remained at the high school level, which in meetings I've attended with other superintendents and with the County Health Department, seems to be the trend throughout the State.
Caleb Olson:
Exactly. I think if you look at some of the information from the County, they can report by zip code to give you a look at your area for the school district. Our equivalent of that would be the feeder system, the high school and the schools that feed into it. So, if you want to know what your neighborhood is like, you could look at your local school or you can go kind of step back and see the high school and the schools that feed into it. So that's available there for patrons and for our community to look at.
Superintendent Godfrey:
Mike Anderson, Associate Superintendent, let's talk a little bit about the middle column of active cases. We, with the County Health Department, determine these numbers. Can you tell me how an active case is defined?
Mike Anderson:
Yes. I work with the County Health Department on a daily basis. It's one of my “other duties as assigned”, right? Currently active case as defined by the Health Department is 14 days from the day that it is first reported to public health. And it stays on their records for those 14 days. After that, it will drop off.
Superintendent Godfrey:
In the active cases, we have several categories. You'll see a zero if there are no cases at a particular school. And then, if the number is from one to six, we just put that range. So, it's either zero, meaning there are no cases, or one to six, meaning there are one to six active cases. Then, if there are more than six cases, we'll give the individual number of cases at that school. Can you explain to everyone why it is that there is not an individual number all the way down to one?
Mike Anderson:
Well, in cases of one to six, one of the concerns is that those cases would become personally identifiable. It wouldn't be hard to know that if we listed a school as having one case or two cases who those students are in that building. So out of a concern for privacy and out of a concern for what we refer to as FERPA, which is the Family Education Rights to Privacy Act. If our case count is above the range from one to six, we start listing the actual number of cases. You’ll see that in the middle column. They are coded by color. Anything between seven and fourteen is coded by color as yellow and above 15, we would color code in orange.
Superintendent Godfrey:
So you can quickly see at-a-glance where we have a higher number of cases at a particular school. And, like I said, you can break it down by level or feeder and do some comparisons as well. Now, there are totals at the top of the page as well, and the programmers and our web designer have made it possible for us to have those numbers continually updated on the main webpage. So, even if you're just on the main webpage, those numbers will be there. And that's the current active cases in the district and the individuals in quarantine. But those main totals will also recalculate when you use the dropdown menu on the Data Dashboard page to select either a feeder system or a level. Anything else you would add, Caleb? Any other features or any other aspects of this that you'd like to make people aware of?
Caleb Olson:
No, I hope it's user friendly and good for people to use. It's easy when we start putting numbers in columns like this, to try and have the numbers be accessible. But we also have to remember that each of those numbers is a person who probably doesn't feel too good right now and has had their life turned upside down. We want to get information to people in a way that's easy for them to get to, but also make sure that we're respectful of the people behind those numbers and keep them in mind. I think that's a really important point. The numbers help us make decisions, but those decisions are really based around providing a safe and healthy learning environment and a great educational experience for everyone. We know how important school is and we know how important keeping everyone safe and healthy is. And so, we're balancing those interests and these numbers help us do that. Mike and I were talking about that again last night. Just the fact that each one of these numbers represent someone's life, someone's education and someone's individual circumstance that we're trying to make the best we can.
When there’s a quarantine or positive case, their world has been turned upside down. If I may add personal note here, my son is on quarantine. He was notified and his world has been rocked a little bit, and that's rocked the world of his mother and me. Our entire family's structure has been changed pretty considerably because of that. And so, we want to be sensitive to that. We also want to provide, as you said, good information so that students, parents, families, teachers, and administrators can all make informed decisions. And this is what we hope this Dashboard accomplishes.
Superintendent Godfrey:
Yes. We're all affected in different ways, personally, by this. And the more information we can give to families, employees, parents, students, and members of the community, the better decisions we can all make as we try to get through this together. Thanks very much for all of your hard work to make this possible and for stopping to talk with us on the Supercast today. Thank you. Thanks again to Associate Superintendent, Mike Anderson and Planning and Enrollment Consultant, Caleb Olson for joining us on this episode of the Supercast. You can access the Data Dashboard by visiting https://movingforward.jordandistrict.org/ or click the link on the main page at jordandistrict.org.
Thanks for joining us on another episode of the Supercast. And remember, education is the most important thing you'll do today. We'll see out there.